
Play with the equation: y=mx+b in real life! Change your m by spinning the line 360 degrees or change your b by sliding the line up or down the x and y axes. This fun math tool helps users understand how a straight line can be manipulated by changing the slope and intercepts of a function.
Educational Concepts
- Slope
- x-intercepts
- y-intercepts
- Graphing
Components
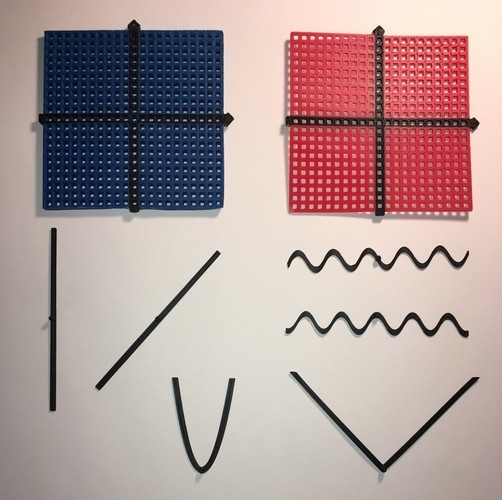
The rotational graphing tool is printed in three parts: a coordinate plane, plug, and line. Simply print each piece, slide the bottom base of the line into the open groove, push the plug into the open groove, and then start graphing!
Dimensions
184 mm x 184 mm x 7 mm
This is the second version and is slightly different than the one seen in the video.
Loading prints...
Rotational Line Graphing Tool
Creative Commons Attribution
You can distribute, remix, adapt, and build upon the material in any medium or format, as long as attribution is given to the creator.
 Licensed under CC BY

Loading comments...